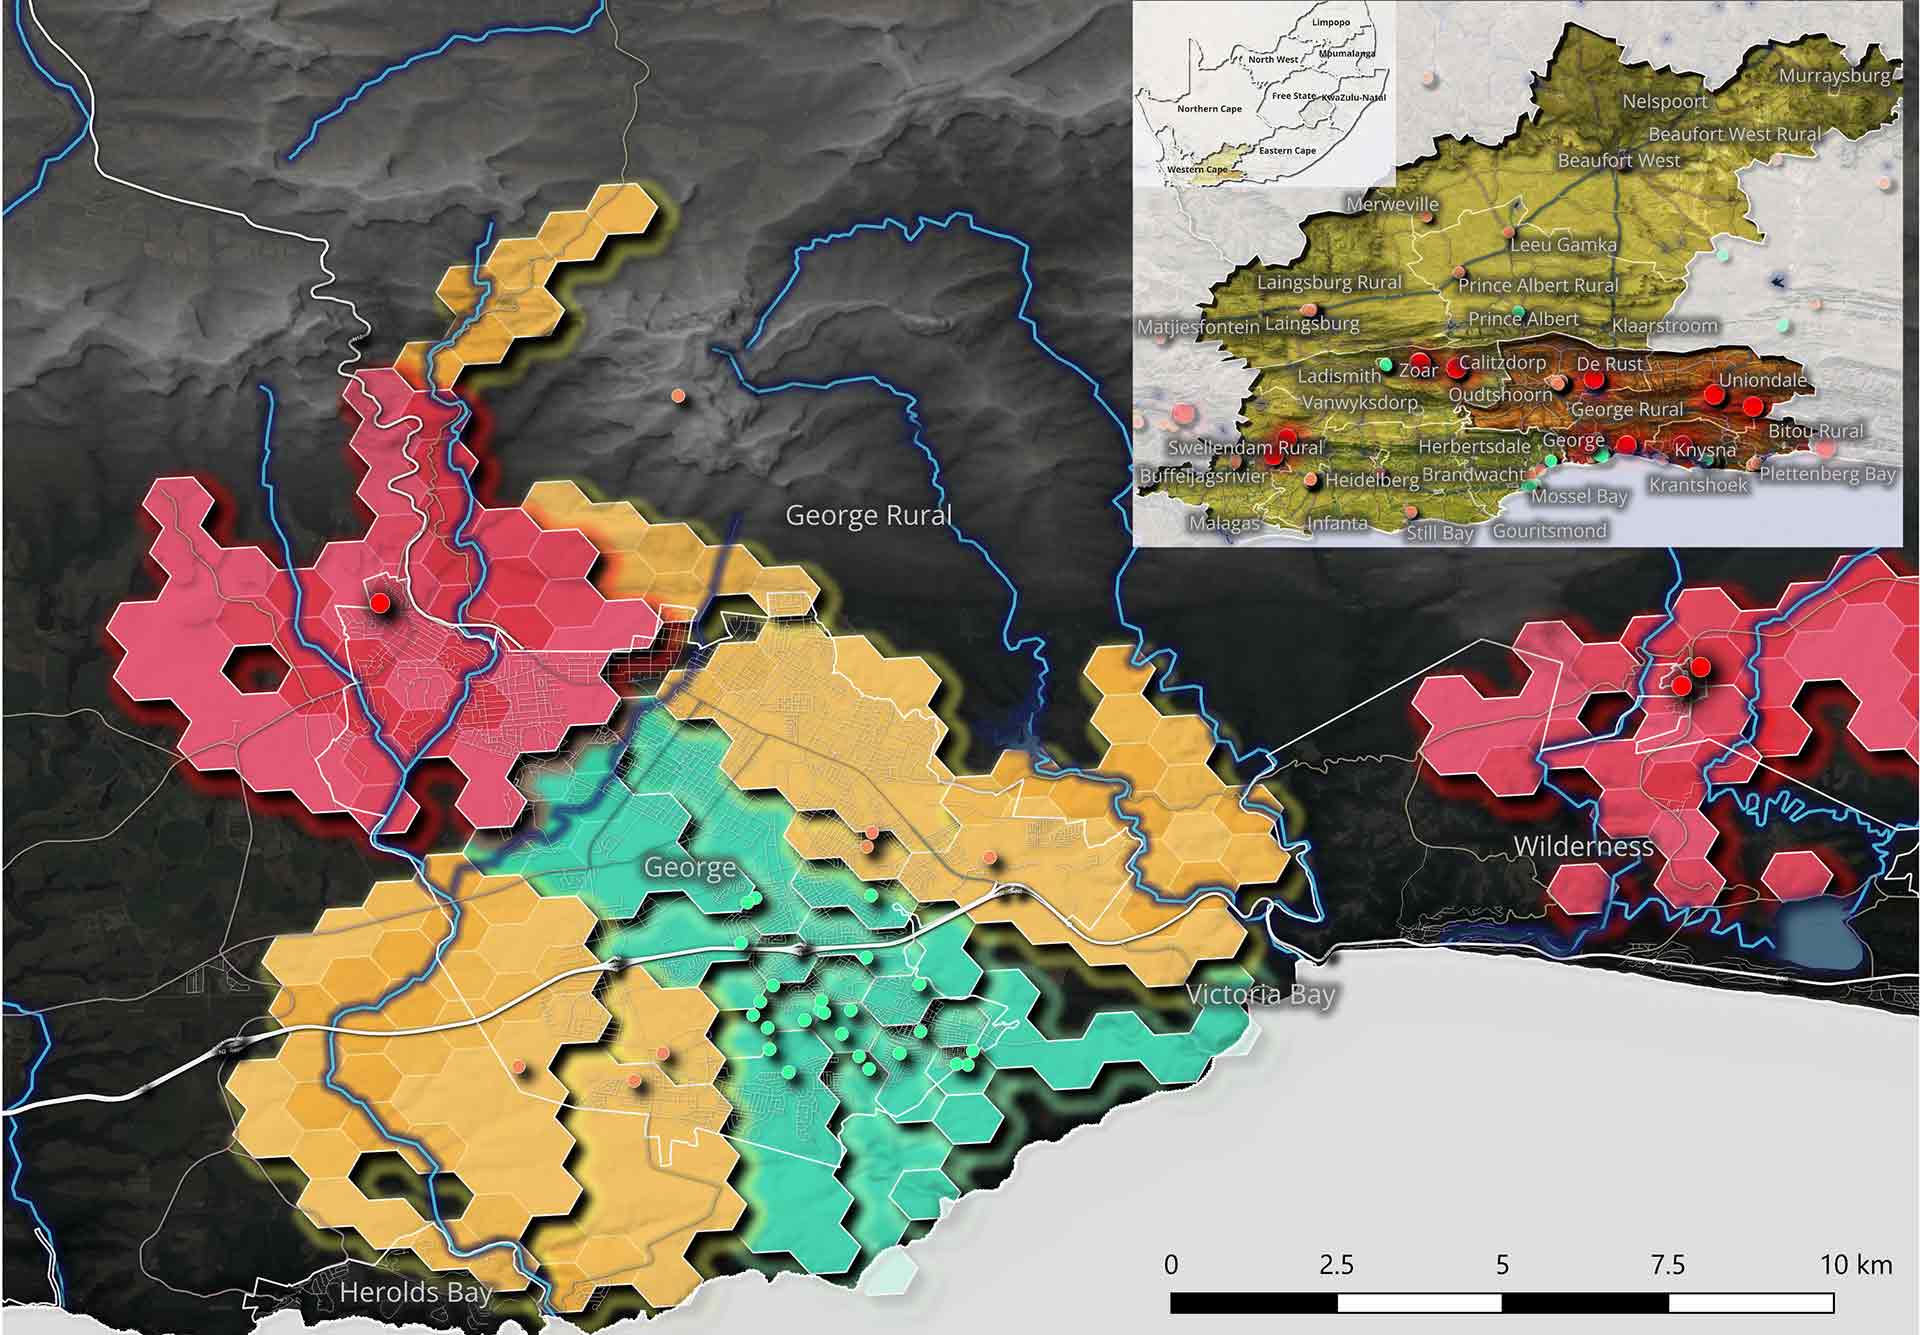
When two cutoff lows struck the Garden Route within a month of each other early this winter, the communities most at risk of being cut off entirely had already been mapped. Before the June storm, with every dam in the district at capacity and the ground fully saturated, AfriGIS had run a road connectivity analysis across the region’s 209 informal settlements and identified 22 at extreme risk of losing all physical access if key river crossings failed. Kannaland and George accounted for 16 of them. The purpose of that work was to let disaster teams pre-position resources and plan evacuation routes before conditions peaked, and that is what it enabled.
Four layers, one life-safety answer
The analysis rested on only four rapidly integrated data layers: roads, rivers, informal settlement locations, and storm warning data. That was enough to answer the question that matters most in a flood: who loses access first, and where. The Western Cape’s response across both the May and June events was widely judged effective given the scale and frequency of the storms, and spatial preparedness applied in advance is part of what produced that outcome. AfriGIS can integrate core layers like these within hours or days of engagement. The constraint in a crisis is rarely the technology.
Every added layer opens a new question
What the Garden Route work also showed is how much more becomes visible the moment you build on that four-layer foundation. Add property deeds and cadastre data, and the framework that answers “who will be cut off” also calculates the estimated rand value of assets exposed inside a defined flood zone, moving a short-term insurer from broad regional loss estimates to parcel-level peril underwriting. Add CIPC business registration data, and it quantifies revenue disruption: the enterprises that could not trade, a dimension building damage alone never captures. For the organisations that own critical infrastructure, rail through flood-prone corridors, national road networks, substations near rising flood lines, the underlying question is identical: where is my exposure, and at what point does it threaten the balance sheet? Each added layer sharpens the previous answer and then opens a different commercial and operational conversation from the same verified base.
Verified data, and a baseline that goes back decades
Provenance is what separates this from conventional risk reporting. AfriGIS sources exclusively from authoritative entities, never crowdsourced, and validates against satellite imagery and on-the-ground checks where confirmation is needed. With 28 years of verified geospatial records for South Africa, risk can be assessed against a trackable historical baseline rather than a single moment. For insurers redrawing flood line assumptions after back-to-back cutoff lows, that longitudinal depth is a material advantage. For municipalities, the case is just as direct: when informal settlement locations, infrastructure maintenance records and access route conditions move off separate departmental spreadsheets and onto a shared spatial platform, water, electrical and emergency teams can each see where their responsibilities meet, coordinate where they must, and act independently where they can. A single spatial source of truth improves decisions in a crisis, and speeds them up when every hour counts.
The season is not over
South Africa’s rainfall season still has months to run. The ground across the Western and Eastern Cape remains saturated, flood lines are being reassessed, and the 22 settlements identified in the Garden Route are a single district’s share of what a national analysis would reveal. The region has now served as a live proof of concept twice in one month. The intelligence to act on it more widely exists today.