

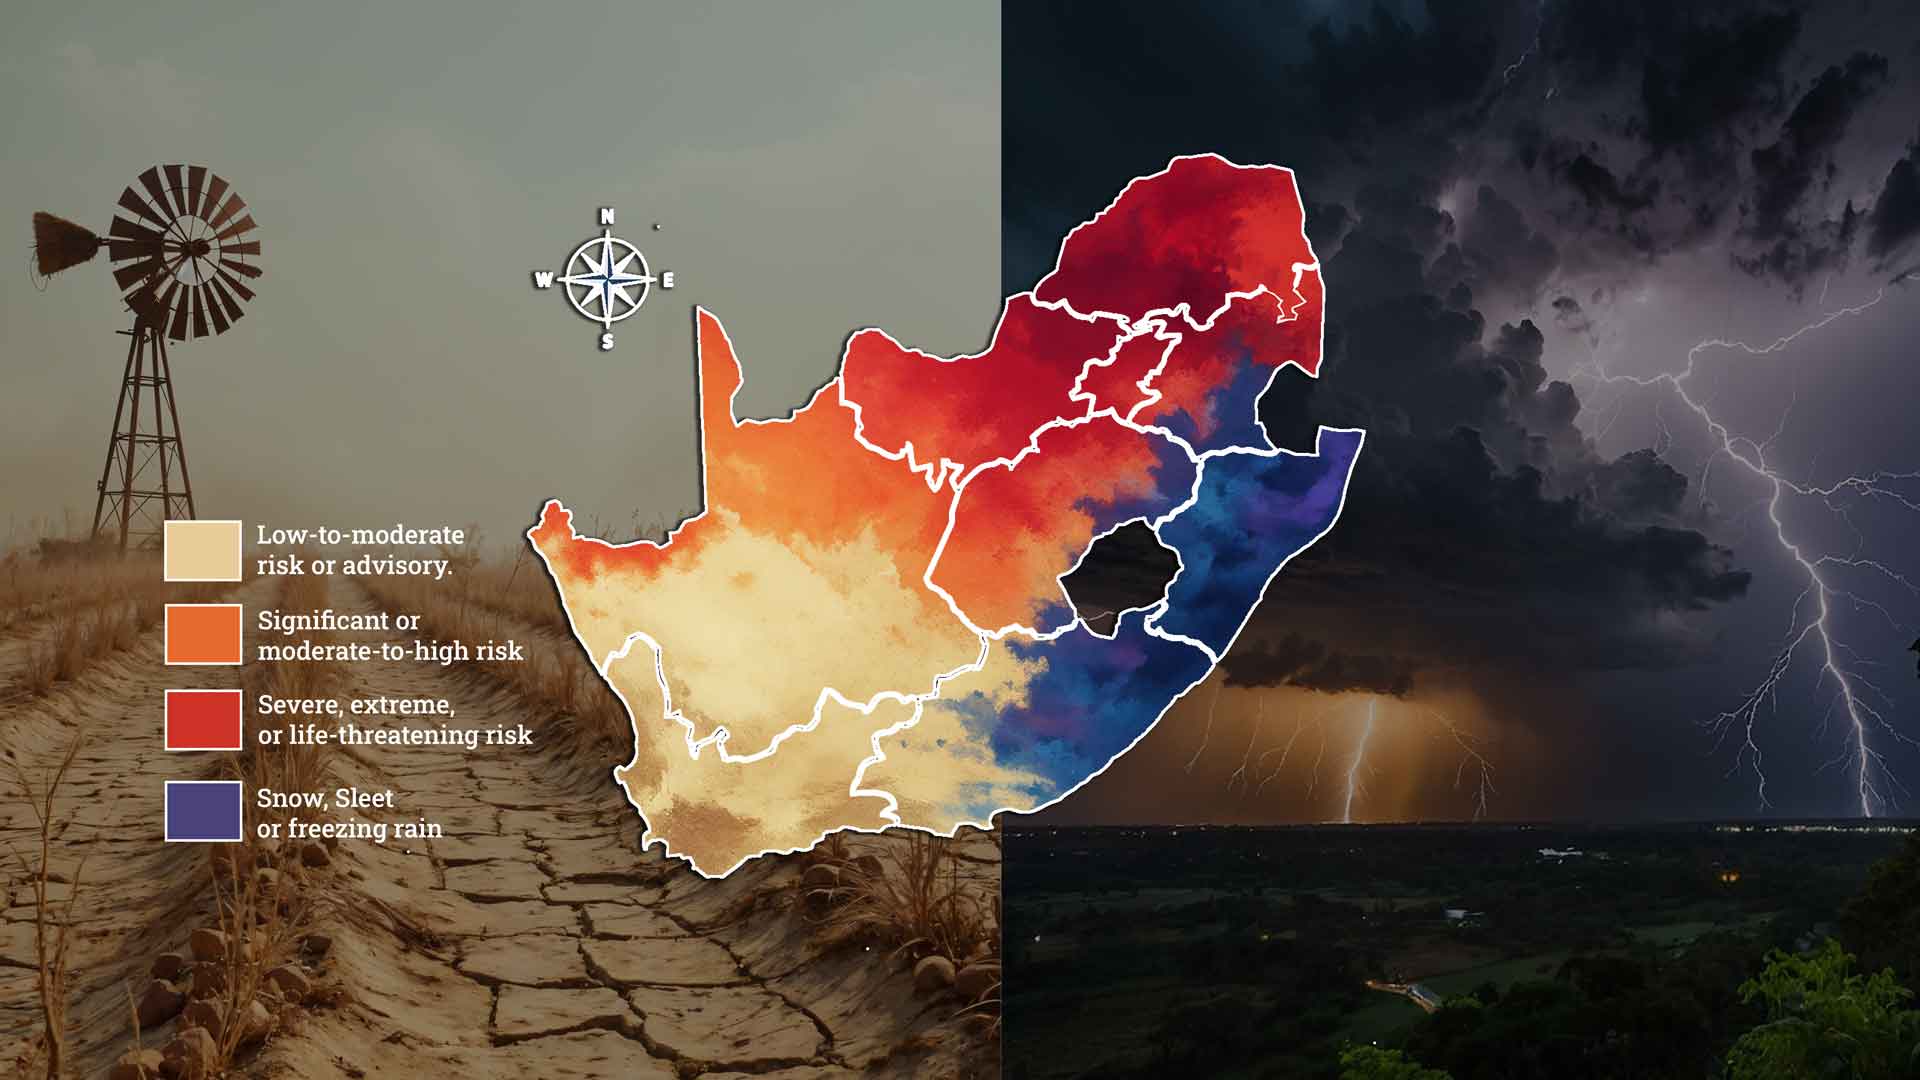
Key insight: A national forecast tells you the country is heading into its strongest El Niño in decades, but it can’t tell a municipal planner in the Free State or an insurer underwriting Eastern Cape farmland what that means for their patch of ground by itself. Overlaying the forecast onto cadastral, suburb and municipal boundary data does.
South Africa’s Weather Service confirmed in September that the 2026/27 El Niño is on course to become the strongest event on record, with sea surface temperatures already tracking past 3°C above normal. AfriGIS has been overlaying that outlook onto its own spatial datasets to work out which municipalities and farming districts carry the most risk – and why a national average hides more than it reveals.
What is a Super El Niño, and how strong could this one get?
A Super El Niño describes a rare, exceptionally strong event: central Pacific sea surface temperatures more than 2°C above normal. It has happened three times before, in 1982/83, 1997/98 and 2015/16. SAWS’s own forecasts put the current event above 3°C, which would place it among the strongest on record.
Which provinces face the highest exposure?
Overlaying the seasonal outlook onto municipal boundary data points to the central interior and pockets of the north-east as the areas of greatest concern:
- North West
- Free State
- Eastern Cape
- Northern Cape
- Limpopo
- Parts of Mpumalanga
KwaZulu-Natal, by contrast, shows up as the most lightly affected province in the current outlook – though this is still forecast data, not certainty.
How does AfriGIS turn a national forecast into a local risk map?
“We’re the vehicle that makes SAWS data available,” says Antonie Peens, GISSA national director at AfriGIS. “You query what the forecast data is and get it back immediately. You’re not waiting on someone to send you a text file.” AfriGIS layers that live weather feed against cadastral, suburb and municipal boundary data, extending to dam-level tracking for anyone reliant on a specific water source, so a single forecast becomes a set of localised risk pictures instead of one national number.
Data source: the underlying weather data is 100% SAWS. AfriGIS’s role is technology provider and delivery mechanism: making that forecast queryable and mappable via a series of API services, rather than producing its own competing model.
Why doesn’t a full dam guarantee safety this summer?
South Africa is coming off a strong rainfall year, and full dams create a sense of security that the coming season may not support. “Last year we had really good rainfall,” says Peens. “Dams are relatively full, so there’s less of a sense of urgency to conserve. But that comfort can actually put us in a difficult position.” The question isn’t the size of the current buffer, so much as how fast that buffer drains if the Super El Niño intensifies as forecast.
Why sector-specific detail matters more than a single average
Farmers, insurers and municipalities draw on the same forecast for different reasons. Farmers track irrigation planning, watching whether evapotranspiration is outpacing water supply. Insurers watch storm and lightning data. Anyone reliant on a single water source tracks dam levels directly. One average forecast can’t serve all three uses at once.
Why planning against this forecast needs to stay continuous
Peens expects the picture to keep sharpening through spring as the event develops, with each update redrawing which municipalities sit closest to red on the map. “Proper planning will be a key component in traversing difficult times ahead successfully,” he says. “But proper planning is a continuous and adaptive process, as opposed to a once-off event. Events such as those driving El Niño are dynamic, and the data around them is too. Decisions need to be made, and they will have to be recalibrated just as continuously as the data insights around them change.”
Frequently asked questions
What counts as a Super El Niño?
An El Niño event where central Pacific sea surface temperatures rise more than 2°C above normal. Only three have occurred since 1980. SAWS’s current forecast puts the 2026/27 event above 3°C.
Which South African provinces are most at risk this season?
Municipal boundary data points to the North West, Free State, Eastern Cape, Northern Cape, Limpopo and parts of Mpumalanga as the areas facing the highest combined heat and drought exposure. KwaZulu-Natal currently shows up as the most lightly affected province, though that’s still forecast data rather than certainty.
Does South Africa’s good recent rainfall reduce this year’s risk?
Not on its own. Full dams lower short-term urgency but don’t change how quickly that buffer could be drawn down if the forecast heat and rainfall pattern holds.
How can organisations access this risk data directly?
Through AfriGIS’s API services, which deliver SAWS forecast data (temperature, rainfall, fire danger index, UV index and station-level readings) for direct integration into planning and risk systems.
Should organisations plan around this forecast once, or keep revisiting it?
Continuously. Peens describes planning against a Super El Niño as an adaptive process rather than a once-off exercise – decisions need to be recalibrated as the underlying forecast data updates through the season.
Key takeaways
- SAWS confirmed on 1 September that the 2026/27 El Niño is tracking toward the strongest event in living memory.
- Overlaying that forecast onto municipal boundary data identifies specific high-exposure districts rather than one national risk figure.
- KwaZulu-Natal currently shows up as the most lightly affected province in the outlook, though that could shift as the forecast sharpens.
- Full dams reduce short-term urgency but don’t remove the underlying exposure.
- AfriGIS delivers the underlying SAWS data via a series of API services, rather than building a competing forecast model.
- Planning against this forecast is a continuous, adaptive process, not a once-off exercise.

